- Title: Logging
- Start Date: 2021-04-21
- Specification PR: #33 (opens new window)
- MeiliSearch Tracking-issues: transplant/#193 (opens new window)
# Logging
# 1. Functional Specification
# I. Summary
As a user of the MeiliSearch binary, I want to be able to know what is happening in the engine at different levels of granularity depending on my needs.
# II. Motivation
Keeping track of the behavior of a system is useful for those who test, develop and use it in production. The purpose of this specification is to indicate the logging behavior of the search engine.
# III. Additional Materials
# Algolia
Algolia offers an API endpoint dedicated to retrieving the logs of search and indexing operations.
A call on the
getLogsendpoint affect the algolia quota but it is not counted as a log.The logs are kept for a period of 7 days. After this period, they are no longer accessible from the API.
Algolia gives parameters to modify the request according to the user's needs.
A query performed without parameters returns the last 10 records by default.
The maximum number of logs that can be returned per request is 1000.
It is possible to use the offset and length parameters to search the log entries.
A type parameter is also provided to select the type of log to retrieve.
| Value | Description |
|---|---|
| all | All the logs |
| query | Exclusively the queries |
| build | Exclusively the build operations |
| error | Exclusively the errors |
Here is the information that Algolia chooses to return:
| Key | Description |
|---|---|
| timestamp | Timestamp in ISO-8601 format |
| method | Rest type of the method |
| answer_code | HTTP response code |
| query_body | Request body. Limited to 1000 characters |
| answer | Answer body. Limited to 1000 characters |
| url | Request URL |
| ip | Client ip of the call |
| query_headers | Request Headers (API Key is obfuscated) |
| sha1 | Id of log entry |
| nb_api_calls | Number of API calls |
| processing_time_ms | Processing time for the query (Does not include network time) |
| query_nb_hits | Number of hits returned for the query |
| exhaustive | Exhaustive flags used during the query |
| index | Index name of the log |
| inner_queries | Contains an object for each performed query with the indexName, queryID, offset, and userToken |
# TypeSense
TypeSense makes no mention of logs in its documentation. However, the tracing policy seems to be in verbose mode and gives a lot of more or less relevant information.
typesense_1     | I20210403 01:06:33.688689     1 typesense_server_utils.cpp:301] Starting Typesense 0.19.0
typesense_1     | I20210403 01:06:33.690609     1 typesense_server_utils.cpp:304] Typesense is using jemalloc.
typesense_1     | I20210403 01:06:33.730222     1 typesense_server_utils.cpp:405] Starting API service...
typesense_1     | I20210403 01:06:33.730813    82 typesense_server_utils.cpp:210] Since no --nodes argument is provided, starting a single node Typesense cluster.
typesense_1     | I20210403 01:06:33.734120     1 http_server.cpp:189] Typesense has started listening on port 8108
typesense_1     | I20210403 01:06:33.744827    82 server.cpp:1045] Server[braft::RaftStatImpl+braft::FileServiceImpl+braft::RaftServiceImpl+braft::CliServiceImpl] is serving on port=8107.
typesense_1     | I20210403 01:06:33.744860    82 server.cpp:1048] Check out http://1c913ea63cb1:8107 in web browser.
typesense_1     | I20210403 01:06:33.747742    82 log.cpp:674] Use crc32c as the checksum type of appending entries
typesense_1     | I20210403 01:06:33.747857    82 log.cpp:1158] log load_meta /data/state/log/log_meta first_log_index: 1 time: 56
typesense_1     | I20210403 01:06:33.748559    82 log.cpp:1098] load open segment, path: /data/state/log first_index: 1
typesense_1     | I20210403 01:06:33.748966    82 raft_meta.cpp:521] Loaded single stable meta, path /data/state/meta term 3 votedfor 0.0.0.0:8107:8108 time: 193
It also gives the stack trace in case of exception.
# ElasticSearch
Elasticsearch is probably the most versatile search engine when it comes to logging. See the documentation (opens new window).
It is possible to define a precise rolling log strategy.
A rolling log strategy permits to:
- Facilitate the administration of systems that generate a large number of logs.
- automates swapping, compressing, deleting, and sending logs. It assists in keeping the logging system within the specified file system space limits.
- Defines an interval over which log analysis can be performed
- Gives an efficient way to identify log files that are no longer used so that an automated process can clean up and compress the log directory and run log analysis programs.
See more information here about log rotation strategy (opens new window)
This is an important thing to have when systems generate a lot of logs or are under heavy load. It's also a good practice to populate a monitoring dashboard at certain times and, through that, provide an easy way to analyze and understand what happened in the system in a human-readable way.
Internally, Elasticsearch uses log4j2 to track events and configure the logging policy. Logging levels can be configured on a per-package basis, giving the precision needed to monitor a specific feature or time in a search engine's lifecycle.
A log level can be: debug, info, warn, error, fatal, or unknown.
# Elastic Entreprise Search
Elasticsearch's SaaS platform, like Algolia, offers a fairly similar endpoint for browsing system-generated logs.
However, it is possible to disable log storage, change the retention period and also filter the logs with more details.
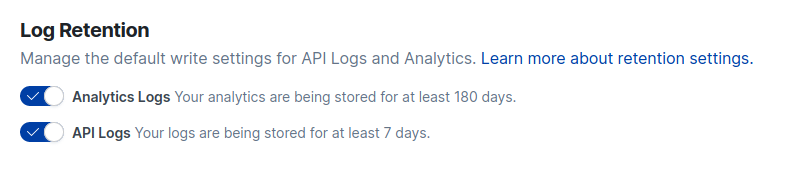 Elastic App Search's Log Retention settings view.
It is also possible to do that from a Log Settings API endpoint.
API Logs track requests and responses at the engine level, while Analytics Logs track requests, clicks and counts.
# IV. Explanation
# Current Logging behaviour of MeiliSearch (0.20)
MeiliSearch uses the rust lib env_logger to output logs based on the log level fetched from the RUST_LOG environment variable. env_logger allows to define a specific log level per module if necessary. See more here (opens new window).
# Logging behaviour for Milli (0.21)
We have decided to keep using the rust lib env_logger for Milli/Transplant. However, we will make some changes to make the logging more consistent and versatile.
Instead of using RUST_LOG, we create a MEILI_LOG_LEVEL environment variable that corresponds to RUST_LOG in the binary to improve its meaning and clarity to users. A CLI option --log-level will also be added to follow our configuration convention.
# Log Levels
| Level | Description |
|---|---|
| ERROR | Everything related to an error. A non blocking error has occured. |
| WARN | Used to warn about an exceptional non-blocking event occurring. |
| INFO | Default Log Level. It displays high level informations of events occuring in the search engine. |
| DEBUG | Used for debugging and development purposes. More verbose than INFO. |
| TRACE | Display everything happening at engine level. Can be useful for rust developers dealing with complex issues |
| OFF | Disable the logs. |
# Log Format
[2021-03-02T20:33:09Z INFO actix_web::middleware::logger] 172.17.0.1:57220 "POST /indexes/indexUID/documents HTTP/1.1" 202 14 "-" "PostmanRuntime/7.26.10" 0.023529
# Mandatory log format part. E.g [TIME_FORMAT LOG_LEVEL MODULE] part.
- Time when the request was started to process (in rfc3339 format)
- Log levels are
ERROR,WARN,INFO,DEBUG,TRACE,OFF. - The module part gives information about the module that records the log.
# HTTP Call
Transplant uses actix_web::middleware::logger to record information about the API endpoints that receive calls.
Given
172.17.0.1:57220 "POST /indexes/indexUID/documents HTTP/1.1" 202 14 "-" "PostmanRuntime/7.26.10" 0.023529
- Peer IP address (or IP address of reverse proxy if used)
- First line of request (Example: GET /test HTTP/1.1)
- Response status code
- Size of response in bytes, including HTTP headers
- User-Agent
- Time taken to serve the request, in seconds to 6 decimal places
At DEBUG log level, the search endpoint must log the request body and the response body.
# V. Impact on Documentation
The documentation only mentions the logging behavior for the development env on the MEILI_ENV part.
We should explain how to specify the logging level using the MEILI_LOG_LEVEL environment variable and display the logging level table as information in a dedicated section. It should also mention the usage of the cli flag --log-level.
# VI. Impact on SDKs
N/A
# 2. Technical Aspects
N/A
# 3. Future Possibilities
- Store logs on filesystem (give us future possibilites of rolling strategy). We will keep an eye on https://roadmap.meilisearch.com/c/81-specify-log-path, Github issues and, Slack Community messages. Keep in mind that it is possible to send logs to files using
syslogorsystemdjournalctl. - Develop an API endpoint to search for logged events and configure the logging policy for the instance (SaaS feature in mind).
- Add syntactic sugar helper flag like
-v, -vv, -vvvthat can be translated to aMEILI_LOG_LEVELvalue. - Use the rust clone of
log4j2,log4rs(opens new window) instead ofenv_loggerto provide the same kind of options that Elasticsearch propose.
# 4. Planned Changes
# 0.21
# Core
- Use a consistent method to log (relative to internal implementation).
- Log output should start with the mandatory log format part.
- The HTTP logs should be logged as described in this spec.
- The users should be able to choose the log level by filling the
MEILI_LOG_LEVELenvironment variable or using the CLI option--log-level. - If log level is set to
DEBUG, the/searchendpoint should output request parameters and body response as a log output. - Logs should be displayed in production environment as in development environment, e.g. the default log level is INFO
- Milli only display logs from
DEBUGtoTRACElog level.
# Documentation
- Add a dedicated logging section in the documentation.
- Add a link to this dedicated section on the
environmentsection (opens new window). - We should add the default level for the production environment on the
environmentsection, by default itsINFO.